In a former life, when hormones and beer lust ruled the roost, I traded currencies in London hours out of Sydney. Staring at the screens from my monastic cell today, reminds me of those misbegotten days trying to guess where the squiggles are going to turn next...
A comment from a broker in London comes to mind, we are in the casino playing craps..."You play with fire sometimes"...he wasn't talking about my expertise at rolling dice but a mean reversion trade that I'm prone to putting on.
And that is where we are now. The market is running hard. It has all the hallmarks of the blow-off top. To be short at the wrong level hurts. Do you cut the position or add to to it?
What does a blow-off top feel like? When will exhaustion set in? And where will a retracement, assuming there is one, take us?
Going through them in turn...
What does a blow-off top it feel like?
1) It hurts - not only is the price running against you, the market scorns your views.
2) It's fast - adding to a position, at what you think is a good level, quickly runs against you.
When will exhaustion set in?
1) It's parabolic - prices can run, and typically do run, further than you expect.
2) The popularly accepted target level - the market psychology is one of trying to catch the last x% of the move. There is a feeling of certainty that the market will reach the given level (in our case, XJO to 5000). The buyers at current levels are looking to capture that last x% and then get out. The sellers are already set or too scared to jump in. The exits will be overcrowded as we approach the 'target' level.
Where will a retracement take us?
1) Buyers of the dip - the blow-off top will have sucked a lot of these reluctant buyers in for fear of missing the big trend. They will be the first to sell on a break of the up-trend.
2) To the last level where long term buyers were left hungry - Support will first appear where the under-invested but cautious investors are waiting. Logically this will be at the top of the head of the 'head & shoulders' that shall not be named.
So back to my broker, my response was that I'm looking for the market to come back to the trend.
I will add to the short as the 'popular target' approaches. At its simplest, the short trade is looking for a move back to longer term support. If we break lower from there so be it. If, against the wash of fundamental data, the market finds legs, I'm happy to go with that too. My experience suggests there is a trade to be made from betting against the parabolic move...
Thursday, September 17, 2009


Wednesday, September 16, 2009
The good and the bad
Following is a summary of the pressure points in the market over the nearish term. It's not intended to be exhaustive nor particularly prescriptive...more the impressionist in me trying to find expression (shudda picked up a paintbrush rather than a HP12C?).
.jpg)
The objective was to get some clarity around some of the path critical events that may or may not happen. For example:
.jpg)
The objective was to get some clarity around some of the path critical events that may or may not happen. For example:
- Liquidity tightened - is a near certainty in the near term. The Fed has $14.9 billion left in the POMO kitty. The Europeans remain as disfunctional and disjointed as ever, don't expect the ECB to keep underwriting the periphery indefinitively. The Chinese caused a tremor in their market when they hinted at tightening credit standards back in June. Question is whether the rally can sustain its bid without the cash injections?
- Banking regulations - mutterings from the G20 suggest consensus that banks will be required to hold more capital and more liquidity and be allowed less off balance sheet leverage. It may take some time to unfold but all these things work counter to the money multiplier and banking profits.
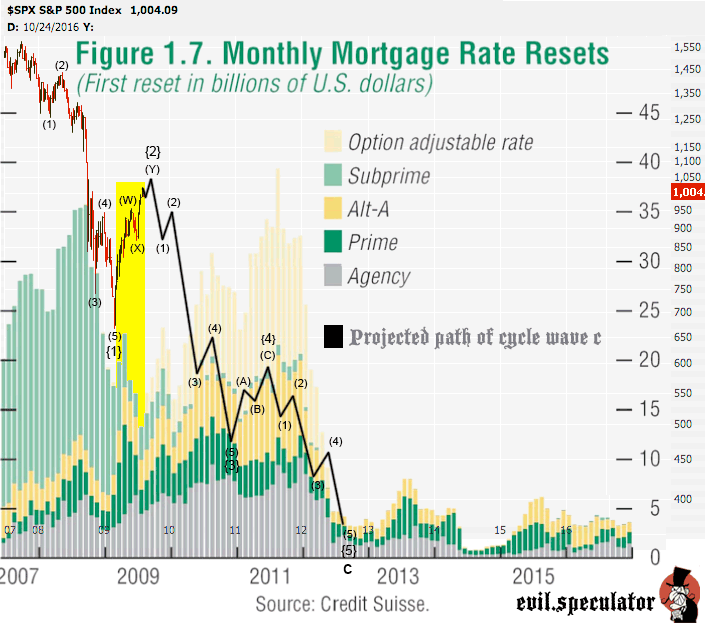
- US mortgage stress - Meredith Whitney is one of the clearest thinkers on the US banks and housing markets - she expects another 25% down in house prices with banks really struggling from here given they are at their reserve limits at current price levels. She observed that to date no one has been prepared to hit the bid - meaning that the state sponsored approach has been to paper over the problems and hope to maintain an orderly selldown. The implication is that this round (should it happen), there is a risk that the fire sales begin. The Evil Speculator has put together an interesting chart that shows the upcoming reset mountain (and his own interpretation of a snail crawling along a razor's edge).
- End of fiscal stimulus - Fiscal stimulus has probably peaked across the major economies (Cash for Clunkers ends and auto sales down in September, China steel prices down in September due to stockpiling for example). The strength of the rebound in economic activity will be tested as the fiscal stimulus rolls off - some like David Rosenberg say the recovery is all due to the fiscal measures.
- Bailout of Europe - the likes of Italy, Greece and Spain are truly pickled. The Euro might survive, but the political cohesion required to fund the bail-out of one or two of these countries will be something new for Europe. This is a reasonable likelihood and would not be good for the EUR.
- Eastern Europe collapse - probably more likely than not that one of the Baltic states will fold under its debt burdens or from civil unrest or maybe a combination of both. The Latvians must be pretty pissed that they are the only country around the world that is being subjected to the rack (while everyone else gets the fluffy pillow around the face treatment).
- China bubble - are we at the start of a bubble or the end of one? From this distance, and looking through the red veil, it's too bloody hard to tell. In the one camp, there are the likes of Andy Xie and on the other articles like this from Soc Gen (via The Pragmatic Capitalist).
- US government credibility fails - worst case scenario is that faith in the oval office fails and the USD makes a quantum leap into another universe. It's unlikely but possible - if the government keeps pumping in the cash like it has some. At the limit, the threat of this type of event will constrain US government actions (it's probably more likely that the government starts a new war).
- Loose monetary policy - zero interest rates for as far as the eye can see. If there is a hint of a self sustaining recovery, those companies that are positioned for it will enjoy low interest rates - both at the near and far end of the curves. Don't expect inflation until some of the world output gap has been closed.
- Corporate earnings - again companies that are able to leverage economic activity will benefit from rising productivity and lower labour unit costs. This is a good thing if you can get it.
- World GDP growth at 3% - Credit Suisse in a report published by TPC point to the arithmetic that would deliver the world GDP growth of around 3%. It rests on the emerging economies steaming ahead. If China can continue it's recent form who knows? They have deep pockets and like to build things...
Monday, September 14, 2009
It is liquidity driving the market
The economist David Rosenberg makes the headline statement in today's missive that "It's not liquidity driving the market". Rather than guess at his motivations - let's have a look at how liquidity is driving the market.
First up, define liquidity as referring to the relative ease with which an asset can be sold. Typically, selling an asset for cash is the most expedient way to realise an asset's value. In a sense, cash is the most liquid of assets (as a store of value its pretty darn good most of the time and everyone is happy to use it as a medium of exchange). For this reason, cash is at the very heart of the liquidity concept.
When there is an abundance of liquidity for a given asset, selling it can be achieved quickly and with minimum price disturbance to that asset. When there is an abundance of liquidity in an economy as a whole, there is lots of cash available to buy assets - it is relatively easy to sell assets across the risk spectrum.
From this definition, the impact of liquidity on markets seems straightforward. To get a sense of how it can be measured, a former roomie of Mr Rosenberg, Stephen Roach, points to a useful indicator:
My favorite gauge of the quantity dimension of liquidity is the so-called “Marshallian K” -- the difference between growth in the money supply and nominal GDP. In essence, this measures the surplus of money that is not absorbed by the real economy.
When the money supply is growing faster than nominal GDP, then excess liquidity tends to flow to financial assets. On the flip side, if money supply is growing more slowly than nominal GDP, then the real economy absorbs more available liquidity.
Under this model, asset price inflation will be the result of excess liquidity. For example have a look at some research from BCA on the correlation of the US$ gold price with the Marshallian K and then as compared to CPI:

Now while David makes the point that the Fed's most recent pumping of the monetary base has had little impact on broader money aggregates (as bank lending continues to contract at record rates), by taking a step back from the four week data we can see that the Fed has provided the system with a mountain of cash (charts from the St Louis Fed):
.jpg)

Conceptually, this view of liquidity helps explain how treasuries can continue to rally in tandem with equities markets and economic indicators pointing to a recovery (latest being the OECD leading indicators - have a look at the charts, there are some scary ones).
The conclusion - it may be an over-simplification to say "liquidity is driving the market", but as a generalisation it has greater merit than suggesting the opposite.
The actions of central banks around the world are predicated on the basis that they are enhancing liquidity. The objective might be to loosen up the money multiplier/creation process (not that they are necessarily having much luck on this front) but the effect is clearly being felt in asset prices. Banks may not be lending but they are investing all this cheap money they have been given in carry trades where ever they can find them.
Which leads us back to the question, where is liquidity going? - or rephrased, how long will governments continue with quantitative easing? The Fed has indicated a strategic withdrawal in October. Without the methyl, I'm expecting asset prices to correct...
First up, define liquidity as referring to the relative ease with which an asset can be sold. Typically, selling an asset for cash is the most expedient way to realise an asset's value. In a sense, cash is the most liquid of assets (as a store of value its pretty darn good most of the time and everyone is happy to use it as a medium of exchange). For this reason, cash is at the very heart of the liquidity concept.
When there is an abundance of liquidity for a given asset, selling it can be achieved quickly and with minimum price disturbance to that asset. When there is an abundance of liquidity in an economy as a whole, there is lots of cash available to buy assets - it is relatively easy to sell assets across the risk spectrum.
From this definition, the impact of liquidity on markets seems straightforward. To get a sense of how it can be measured, a former roomie of Mr Rosenberg, Stephen Roach, points to a useful indicator:
My favorite gauge of the quantity dimension of liquidity is the so-called “Marshallian K” -- the difference between growth in the money supply and nominal GDP. In essence, this measures the surplus of money that is not absorbed by the real economy.
When the money supply is growing faster than nominal GDP, then excess liquidity tends to flow to financial assets. On the flip side, if money supply is growing more slowly than nominal GDP, then the real economy absorbs more available liquidity.
Under this model, asset price inflation will be the result of excess liquidity. For example have a look at some research from BCA on the correlation of the US$ gold price with the Marshallian K and then as compared to CPI:

Now while David makes the point that the Fed's most recent pumping of the monetary base has had little impact on broader money aggregates (as bank lending continues to contract at record rates), by taking a step back from the four week data we can see that the Fed has provided the system with a mountain of cash (charts from the St Louis Fed):
US Adjusted Monetary base
.jpg)

Conceptually, this view of liquidity helps explain how treasuries can continue to rally in tandem with equities markets and economic indicators pointing to a recovery (latest being the OECD leading indicators - have a look at the charts, there are some scary ones).
The conclusion - it may be an over-simplification to say "liquidity is driving the market", but as a generalisation it has greater merit than suggesting the opposite.
The actions of central banks around the world are predicated on the basis that they are enhancing liquidity. The objective might be to loosen up the money multiplier/creation process (not that they are necessarily having much luck on this front) but the effect is clearly being felt in asset prices. Banks may not be lending but they are investing all this cheap money they have been given in carry trades where ever they can find them.
Which leads us back to the question, where is liquidity going? - or rephrased, how long will governments continue with quantitative easing? The Fed has indicated a strategic withdrawal in October. Without the methyl, I'm expecting asset prices to correct...
The real economy - trade flows
The timely and aggressive actions of governments around the world have seemingly averted disaster. A variety of economic indicators point to stabilisation, if not outright recovery. The liquidity that is sploshing around the global economy is finding its way into asset price inflation in an echo of the aftermath of the 1987 crash.
Is the global financial crisis over or is the real economic crisis just beginning? I'm gonna try to have a deeper look at the liquidity effect later in the week - today the focus is on trade as an indicator of the 'real economic' situation.
Question: why has the Baltic Dry Index dropped by ~40% since the start of June while the S&P500 has risen by 13% over the same period?
.jpg)
The BDI is a composite measure of worldwide shipping prices for dry bulk cargoes which comprise the majority of worldwide cargo traffic. It takes in 26 shipping routes and covers dry bulk barriers carrying a range of commodities (coal, iron ore and grain etc.). As the departure point for many a supply chain, it is often considered a leading indicator for industrial production and world economic growth.
While over the medium term, the BDI will be impacted by the supply side of the shipping equation (China likes building big boats - expect overcapacity to be visiting a port near you sometime soon) in the short term it is much more sensitive to simple demand and supply for the commodities being shipped.
In that context, you can clearly see the impact of the global government spending spree that commenced in late 2008. It's well documented that China was on a stockpiling binge over the first six months of 2009, which supports the ramp up in the BDI.
Then what? The party seems to have hit the wall.
While governments and brokers point to the turning up in GDP and industrial production numbers in developed countries, the BDI is suggesting the near term run-up in commodities trade volumes is done. This correlates with comments from the likes of BHP suggesting that China is finished stockpiling and hoping that Europe and the US take-up the slack in the form of re-stocking. In short, the BDI is not signalling confirmation that the developed world is doing anything but trying to find a bottom at vastly reduced trading levels.
Consider the following chart of world trade growth from the OECD Economic Outlook June 2009:
.jpg)
This translates to world trade growth projections like the following:
OECD forecasts for year-on-year changes in world trade volume for 2009: -12.0% and 2010: +5.5%
World Bank forecasts for year-on-year changes in world trade volume 2009: -9.7% and 2010: +3.8%
IMF forecasts for year-on-year changes in world trade volume 2009: -12.2% and 2010: +1.0%
I'll leave you to extrapolate your favourite forecast onto a chart of trade volumes (data from CPB Nederlands as at June 09):
.jpg)
The clear point from this is that world trade has fallen a long way, and while it may have turned up, it is unlikely to recover its peak for a considerable time.
And here we have one of the core problems facing the global economy. The trade imbalances that were financed by debt remain unresolved. Untangling these is likely to be a painful process.
Have a quick look at the breakup of export flows for some of the major economies from 2008 (UN data).
.jpg)
Ideally, I was going to match up against imports - but this piece has run over budget. However, some quick observations:
1) Germany is an exporting machine - but to Europe. The periphery figures highly as the importing counterpart (and it would have been financed on credit). Europe's trade imbalance hangs heavy over the future political stability of Europe and the Euro. It's one of the key potential positives for the USD.
2) Japan has developed a handy export business to China. It's been suggested that Japan may be one the key beneficiary's of the industrialisation of China in the long term. This hasn't stopped Japan from being severely hit by a drop in exports (~30%) that has triggered deflationary forces internally.
3) US relies on exports to Latin America and Canada. The relative under-performance of the USD versus these regions assists its export efforts in this respect. The problem is the import side of the ledger (not shown) where the US has been importing deflation. (See Albert Edwards chart.) It's just cheaper to get goods made in China (note that ~60% of China's trade surplus with the US comes from US companies that manufacture goods in China and then import into US).
4) China has built a diversified export empire. Amazing. But it remains dependent upon exports to support its economic growth model.
So not only is the trading pie getting smaller, the make-up of the pie is not conducive to a quick solution. The surplus trade economies remain hooked on exports. The deficit countries are tapped out, unwilling and unable to continue to buy whether from exporters or their own economies. The ideal objective is for the two to swap roles, at least for a little while. That is going to be tough.
Conclusions:
1) Expect 'protectionist' measures - resolving trade imbalances will be painful. In the debtor nation, it requires falling living standards and for open market economies like the US, higher unemployment. expect governments to come under increasing pressure to protect jobs and ensure that its spending stays at home (eg. US tariffs on steel and tires).
2) Expect surplus countries to export deflation - their economies are geared to exports. While China wants to increase its domestic consumption (36% of GDP), it will not happen overnight. Not only is China a big lender to the US, its biggest customer is the US. Chinese overcapacity will flow back into the US (and globally) as cheaper prices on goods (eg. steel into South Korea).
3) Expect China to buy the farm, not the produce. While the Chinese have been stockpiling industrial commodities in the first half, and this has propped up trade volumes, we can question the longevity of this strategy. It seems to me that they will be more inclined to buy the physical asset (the mine, the permit, the offtake agreement) than take the commodity out of the earth, ship it half way round the globe, just to have it sit in a warehouse. (China annexing parts of Africa when the locals revolt against perceived empiricism.)
Thursday, September 10, 2009
Get Shorty 2
Remain stubbornly of the view that another major leg down in the market is inevitable. But in a society where just-in-time means calling ahead to say you are running late, it's not surprising that us punctual types are always early.
Rather than re-run the many reasons as to why fundamentally, sentimentally and technically this rally should be very near its use-by date, I give you this chart:
.bmp)
I will add to shorts if and (more likely) when we get to the breakdown zone around 4680-4740. I'm expecting this resistance to hold first-up and, perhaps in tune with the prospect of index selling next week, wouldn't be surprised to at least see a retracement to 4460/80.
From there depends on how the top plays out. On balance, given the strength of this move, the base case should be a parabolic blow-off to 5000 through October.
My thinking is that the market could turn on a dime at any time. Hence the core short position. But for a near term reversal to happen it requires a catalyst (a sovereign default in Europe for example). Given the internals of this market are built out of genetically modified straw, the spark does not have to be big (a small sovereign state default then?).
However, in the absence of a catalyst, a top is more likely to be found through sheer toe-curling exhaustion. 5000 is the level to target here. It's a 50% retracement of the whole down move. It balances the A and C waves nicely. It's a lovely round number. It would make for a nice view over the edge for a traditional October wipe-out. Really, the only reasons I can come up with are technical cause everything else points down - now.
Rather than re-run the many reasons as to why fundamentally, sentimentally and technically this rally should be very near its use-by date, I give you this chart:
.bmp)
I will add to shorts if and (more likely) when we get to the breakdown zone around 4680-4740. I'm expecting this resistance to hold first-up and, perhaps in tune with the prospect of index selling next week, wouldn't be surprised to at least see a retracement to 4460/80.
From there depends on how the top plays out. On balance, given the strength of this move, the base case should be a parabolic blow-off to 5000 through October.
My thinking is that the market could turn on a dime at any time. Hence the core short position. But for a near term reversal to happen it requires a catalyst (a sovereign default in Europe for example). Given the internals of this market are built out of genetically modified straw, the spark does not have to be big (a small sovereign state default then?).
However, in the absence of a catalyst, a top is more likely to be found through sheer toe-curling exhaustion. 5000 is the level to target here. It's a 50% retracement of the whole down move. It balances the A and C waves nicely. It's a lovely round number. It would make for a nice view over the edge for a traditional October wipe-out. Really, the only reasons I can come up with are technical cause everything else points down - now.
Wednesday, September 9, 2009
Internal devaluation defined
There is a certain symmetry to the Swedish oeuvre - boxy Volvo's, Bjorn Borg's headband, ABBA's white jumpsuits, losing the kids in Ikea...and now 'internal devaluation'.
It's a term that appears to be gaining some traction (albeit that it is yet to register a tremor on the Google Trends richter scale). I wouldn't be surprised to hear it used by mainstream media in relation to the US-China relationship sometime soon.
If it sounds like an oxymoron that's because, strictly speaking, it is. (Perhaps that is why I like it so.) 'Devaluation' refers to a process whereby a certain thing reduces in value relative to another thing - by definition this other thing is external to the first. It typically refers to a country's currency reducing in value relative to others.
The Swedes first coined the phrase back in the late 90's when exploring mechanisms to manage their economy should they join the Euro. It has gained in prominence in recent times as a way to describe the adjustment process that Latvia has adopted to gain access to IMF supported funding. No surprise that Swedish banks are the biggest creditors to Latvia.
Anyway, the essential thrust of the concept is that a country in a fixed exchange rate regime can still manage its relative competitiveness by reducing its labour costs through fiscal measures. For example, a country could finance a decrease in payroll taxes through increased income taxes. Such a shift reduces real labour costs and therefore increases the competitiveness of exports - while also being budget neutral and reducing consumer demand in that country. In theory, it therefore achieves a similar outcome as a currency devaluation. (And to be fair, as the objective is to reduce the labour costs relative to that country's trading partners, there is some internal logic to calling it an internal devaluation.)
In Latvia's circumstances, it seems that the term has departed somewhat from its original meaning. The IMF sponsored plan calls for 20% cuts in public sector wages, 20% cuts in pensions, an increase in VAT from 21% to 23%, rises in the average effective rate of personal income tax etc... There isn't much focus on labour productivity or unit costs. It's simply reduce the budget deficit at all costs.
From this distance (which admittedly is a long way) it seems that Latvia has been bent over in an attempt to save some of those Swedish bank loans - there is a general consensus that a devaluation of its currency would wipe out a great swathe of what's left of the private sector given the impact this would have on EUR denominated debt.
The people of Latvia aren't happy.
Now while this is all very interesting (or not) what has it to do with the price of fish (outside Riga)? The answer is that some pretty important currency relationships around the world are effectively fixed - think the EUR countries and the exchange rate between the US and China. And some of the countries in these relationships are straining from imbalances similar to those that have impacted Latvia.
Consider the US-China pairing. A Fistful of Euros has already suggested that China has applied its own unique brand of 'internal revaluation'. Rather than let the RMB appreciate, it will apply 'rebalancing measures' to increase domestic consumption by increasing social security and healthcare benefits (thereby increasing disposable income as consumers don't have to save for emergencies).
And to flip it around the other way, with China pegging the RMB to the USD, the US is faced with the same obstacles in trying to engineer greater competitiveness for its goods. It's market can respond in the only way it can - increase the ranks of the army of the unemployed, thereby forcing labour market reform. I can almost hear Keating saying "It's the internal devaluation we had to have"...
The funny thing is that the US is doing the exact opposite of the IMF prescribed medicine for Latvia. Everyone knows that there is a logical limit to the amount of debt the government can issue...the question remains how close are we to it?
It's a term that appears to be gaining some traction (albeit that it is yet to register a tremor on the Google Trends richter scale). I wouldn't be surprised to hear it used by mainstream media in relation to the US-China relationship sometime soon.
If it sounds like an oxymoron that's because, strictly speaking, it is. (Perhaps that is why I like it so.) 'Devaluation' refers to a process whereby a certain thing reduces in value relative to another thing - by definition this other thing is external to the first. It typically refers to a country's currency reducing in value relative to others.
The Swedes first coined the phrase back in the late 90's when exploring mechanisms to manage their economy should they join the Euro. It has gained in prominence in recent times as a way to describe the adjustment process that Latvia has adopted to gain access to IMF supported funding. No surprise that Swedish banks are the biggest creditors to Latvia.
Anyway, the essential thrust of the concept is that a country in a fixed exchange rate regime can still manage its relative competitiveness by reducing its labour costs through fiscal measures. For example, a country could finance a decrease in payroll taxes through increased income taxes. Such a shift reduces real labour costs and therefore increases the competitiveness of exports - while also being budget neutral and reducing consumer demand in that country. In theory, it therefore achieves a similar outcome as a currency devaluation. (And to be fair, as the objective is to reduce the labour costs relative to that country's trading partners, there is some internal logic to calling it an internal devaluation.)
In Latvia's circumstances, it seems that the term has departed somewhat from its original meaning. The IMF sponsored plan calls for 20% cuts in public sector wages, 20% cuts in pensions, an increase in VAT from 21% to 23%, rises in the average effective rate of personal income tax etc... There isn't much focus on labour productivity or unit costs. It's simply reduce the budget deficit at all costs.
From this distance (which admittedly is a long way) it seems that Latvia has been bent over in an attempt to save some of those Swedish bank loans - there is a general consensus that a devaluation of its currency would wipe out a great swathe of what's left of the private sector given the impact this would have on EUR denominated debt.
The people of Latvia aren't happy.
Now while this is all very interesting (or not) what has it to do with the price of fish (outside Riga)? The answer is that some pretty important currency relationships around the world are effectively fixed - think the EUR countries and the exchange rate between the US and China. And some of the countries in these relationships are straining from imbalances similar to those that have impacted Latvia.
Consider the US-China pairing. A Fistful of Euros has already suggested that China has applied its own unique brand of 'internal revaluation'. Rather than let the RMB appreciate, it will apply 'rebalancing measures' to increase domestic consumption by increasing social security and healthcare benefits (thereby increasing disposable income as consumers don't have to save for emergencies).
And to flip it around the other way, with China pegging the RMB to the USD, the US is faced with the same obstacles in trying to engineer greater competitiveness for its goods. It's market can respond in the only way it can - increase the ranks of the army of the unemployed, thereby forcing labour market reform. I can almost hear Keating saying "It's the internal devaluation we had to have"...
The funny thing is that the US is doing the exact opposite of the IMF prescribed medicine for Latvia. Everyone knows that there is a logical limit to the amount of debt the government can issue...the question remains how close are we to it?
Monday, September 7, 2009
DJ MARKET TALK: FTSE Downweight May Weigh On S&P/ASX 200
Been trying to get to the bottom of the following snippet that was published on September 3...
0336 GMT [Dow Jones] FTSE Developed Asia Pacific ex-Japan downweight of Australian
equities, resulting from addition of South Korea on Sep. 18, may see up to A$5 billion
worth of funds removed from Australian equities, according to traders and strategists.
Australia's weighting in the index will fall by 9.1 percentage points to 45.82%.
Goldman Sachs JBWere estimates this will generate passive fund outflows of A$600 million
and active fund outflows of A$4 billion. Expects selldown in Australian equities through
Sep. 14-18.
The announcement of the promotion of South Korea from 'Advanced Emerging' to full blooded 'Developed' was made in September last year. The effective date for the change is the close of business on 18Sep09 - so index followers presumably are going to reduce their holdings in a manner that will best match the performance of the index to that date - hence the expected selling 14 through to 18 September.
To give you a context, here are FTSE's classification of Asia-Pacific countries:
Developed - Australia, HK-China, Japan, NZ, Singapore
Advanced emerging - Malaysia, South Korea, Taiwan
Secondary emerging - China, India, Indonesia, Pakistan, Phillipines, Thailand
The rather specialised FTSE Developed Asia ex-Japan index had 287 constituents and a market capitalisation of US$1,418bn as at 31Aug09. Note that 'red chip' shares listed in Hong Kong are also to be reclassified as 'China' effective 18 Sept.
Australia (apparently) makes up 55% of the index or ~A$920bn (which compares to a market capitalisation for the All Ordinaries on the same date of $1,265bn and for the ASX200 of around $1,010bn).
If a 9.1% fall in the index weighting approximates to A$5bn, this implies that FTSE index followers have A$55bn in current holdings in the Australia (or 6% of the index defined universe). Not sure how the likes of Goldman and AMP have calculated the ~$5bn number - but it seems broadly plausible.
Without obtaining the exact index composition from FTSE, we can assume that it broadly reflects that of S&P200. The banks and major mining companies will dominate, while property outside the heavyweights will be a rounding error.
Is $5bn a meaningful number then? Well, daily turnover of the S&P200 is typically in the $3bn to $5bn range. So the short answer is yes, if the value of shares to be sold is in the order of $5bn it would represent a material amount of weekly volume (call it 20%).
As a cross check consider the volume of secondary issuance by month - note that the market has run higher in recent times against a rising tide of issuance (mind you a lot of this supply has been issued at discounts to prevailing market prices).
.jpg)
In summary, if index followers will be selling circa $5bn shares in the week ending September 18, expect the market to be a little soft at that time...
Postscript:
A couple of further thoughts on the $5bn figure
1) The reweighting will only lead to selling where a fund manager is wholly beholden to the index (eg. $100m fund that is benchmarked to the index). If a fund manager follows this index amongst others in its universe (eg. a sovereign wealth fund), then the reweighting may simply lead to a reallocation between indices (South Korea drops out of one and reappears in another). As a somewhat esoteric index in isolation, this must be relevant to some funds - which leads to the next point...
2) I have not come across any funds that are specifically benchmarked to this index. Typically, a MSCI index is used by fund managers in this region - at least in the retail funds management space. Probably doesn't say much as it is not as if I have done extensive studies on fund manager benchmarking.
The point is to take the $5bn with a grain of salt. I have taken Goldman's conclusions at face value.
0336 GMT [Dow Jones] FTSE Developed Asia Pacific ex-Japan downweight of Australian
equities, resulting from addition of South Korea on Sep. 18, may see up to A$5 billion
worth of funds removed from Australian equities, according to traders and strategists.
Australia's weighting in the index will fall by 9.1 percentage points to 45.82%.
Goldman Sachs JBWere estimates this will generate passive fund outflows of A$600 million
and active fund outflows of A$4 billion. Expects selldown in Australian equities through
Sep. 14-18.
The announcement of the promotion of South Korea from 'Advanced Emerging' to full blooded 'Developed' was made in September last year. The effective date for the change is the close of business on 18Sep09 - so index followers presumably are going to reduce their holdings in a manner that will best match the performance of the index to that date - hence the expected selling 14 through to 18 September.
To give you a context, here are FTSE's classification of Asia-Pacific countries:
Developed - Australia, HK-China, Japan, NZ, Singapore
Advanced emerging - Malaysia, South Korea, Taiwan
Secondary emerging - China, India, Indonesia, Pakistan, Phillipines, Thailand
The rather specialised FTSE Developed Asia ex-Japan index had 287 constituents and a market capitalisation of US$1,418bn as at 31Aug09. Note that 'red chip' shares listed in Hong Kong are also to be reclassified as 'China' effective 18 Sept.
Australia (apparently) makes up 55% of the index or ~A$920bn (which compares to a market capitalisation for the All Ordinaries on the same date of $1,265bn and for the ASX200 of around $1,010bn).
If a 9.1% fall in the index weighting approximates to A$5bn, this implies that FTSE index followers have A$55bn in current holdings in the Australia (or 6% of the index defined universe). Not sure how the likes of Goldman and AMP have calculated the ~$5bn number - but it seems broadly plausible.
Without obtaining the exact index composition from FTSE, we can assume that it broadly reflects that of S&P200. The banks and major mining companies will dominate, while property outside the heavyweights will be a rounding error.
Is $5bn a meaningful number then? Well, daily turnover of the S&P200 is typically in the $3bn to $5bn range. So the short answer is yes, if the value of shares to be sold is in the order of $5bn it would represent a material amount of weekly volume (call it 20%).
As a cross check consider the volume of secondary issuance by month - note that the market has run higher in recent times against a rising tide of issuance (mind you a lot of this supply has been issued at discounts to prevailing market prices).
.jpg)
In summary, if index followers will be selling circa $5bn shares in the week ending September 18, expect the market to be a little soft at that time...
Postscript:
A couple of further thoughts on the $5bn figure
1) The reweighting will only lead to selling where a fund manager is wholly beholden to the index (eg. $100m fund that is benchmarked to the index). If a fund manager follows this index amongst others in its universe (eg. a sovereign wealth fund), then the reweighting may simply lead to a reallocation between indices (South Korea drops out of one and reappears in another). As a somewhat esoteric index in isolation, this must be relevant to some funds - which leads to the next point...
2) I have not come across any funds that are specifically benchmarked to this index. Typically, a MSCI index is used by fund managers in this region - at least in the retail funds management space. Probably doesn't say much as it is not as if I have done extensive studies on fund manager benchmarking.
The point is to take the $5bn with a grain of salt. I have taken Goldman's conclusions at face value.
Subscribe to:
Posts (Atom)